Os painéis de controle a seguir, disponíveis através do aplicativo Painéis de Controle do Odoo, permitem monitorar e analisar métricas principais relacionadas a operações e gerenciamento de depósito, bem como gerenciamento de estoque:
Warehouse Metrics dashboard <inventory/dashboards/warehouse-metrics-dashboard>: assesses
stock value and quantity
Para acessar estes painéis, acesse o aplicativo Painéis de Controle, depois, no painel esquerdo, navegue até a seção Logística e clique no nome do painel relevante. O painel abre na visualização principal.
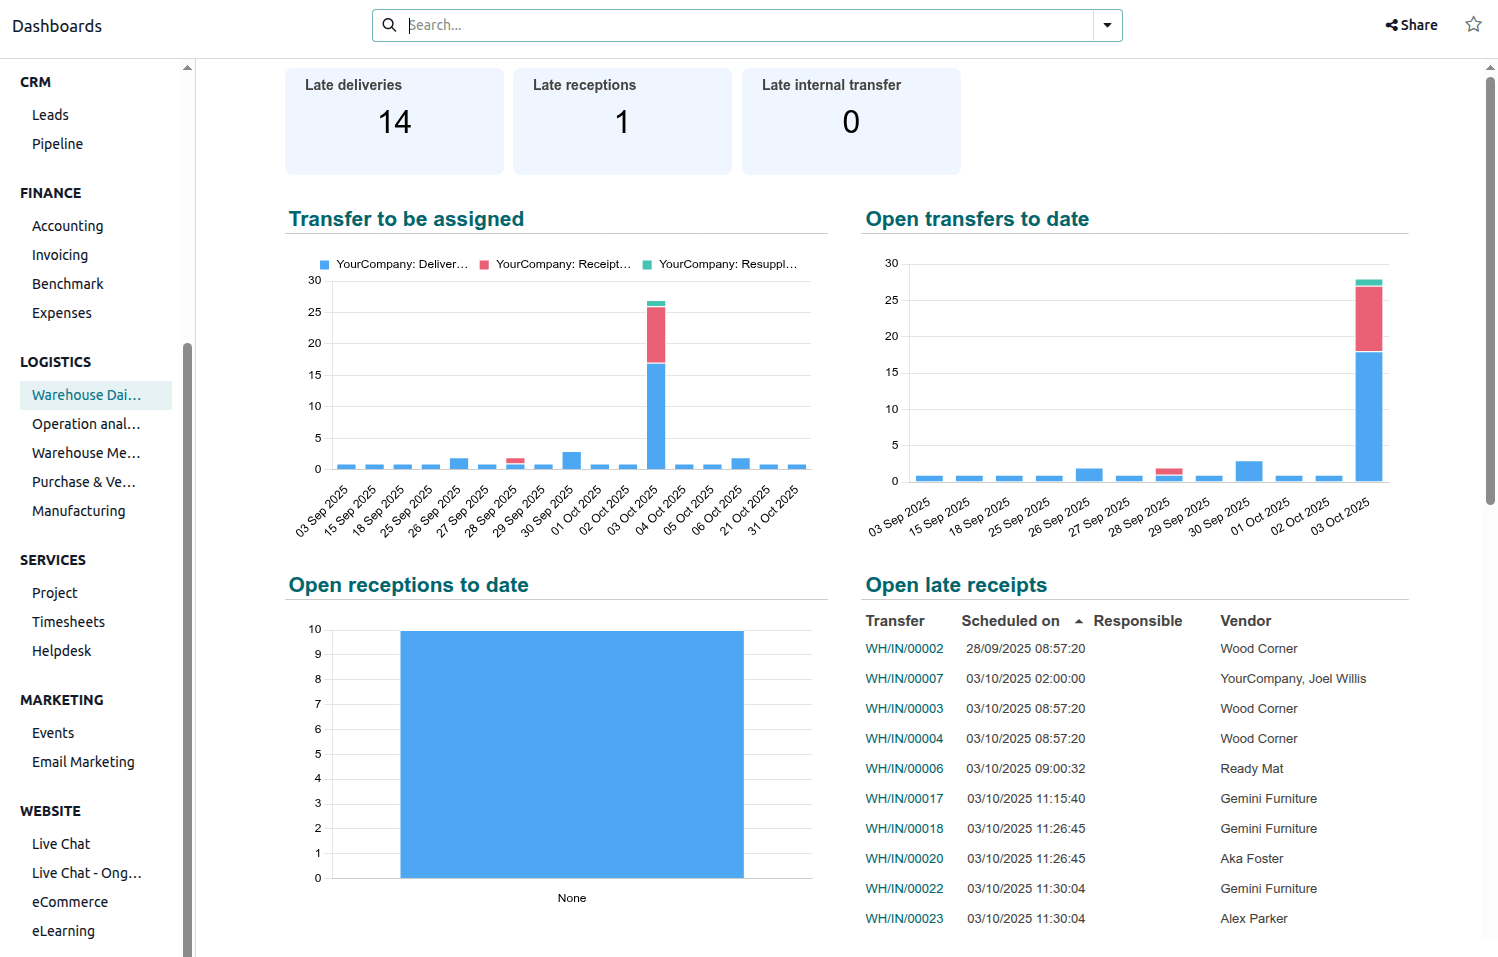
O painel de operações diárias do armazém fornece uma visualização em tempo real de tarefas críticas pendentes em recebimentos, entregas e transferências internas, permitindo que gerentes de armazém priorizem o trabalho e evitem gargalos. Ele identifica imediatamente operações vencidas, bem como transferências que ainda não foram atribuídas a um funcionário. Também prevê atividades agendadas para os próximos 7 dias.
Navegue no painel
Três cards no topo do painel mostram as seguintes informações:
Late deliveries: indicates the number of open deliveries with a past scheduled date
and/or past deadline date.
Late receptions: indicates the number of open receipts with a past scheduled date
and/or past deadline date.
Late internal transfers: indicates the number of open internal transfers with a past
scheduled date and/or past deadline date.
Os seguintes gráficos e tabelas estão disponíveis:
Transfers to be assigned: shows open transfers that have no responsible user assigned.
Open transfers to date: shows open transfers by operation, by date.
Open receptions to date: shows the number of open receipts per responsible user.
Open late receipts: shows the ten oldest open receipts with a past scheduled date
and/or deadline date, in descending order.
Open internal transfers to date: shows the number of open internal transfers per
responsible user.
Open late internal transfers: shows the ten oldest open internal transfers with a past
scheduled date and/or deadline date, in descending order.
Open deliveries to date: shows the number of open deliveries per responsible user.
Open late deliveries: shows the ten oldest open deliveries with a past scheduled date
and/or deadline date, in descending order.
Receptions next 7 days: shows the number of open receipts for the next seven days.
Deliveries next 7 days: shows the number of open deliveries for the next seven days.
Painel de análise de operações
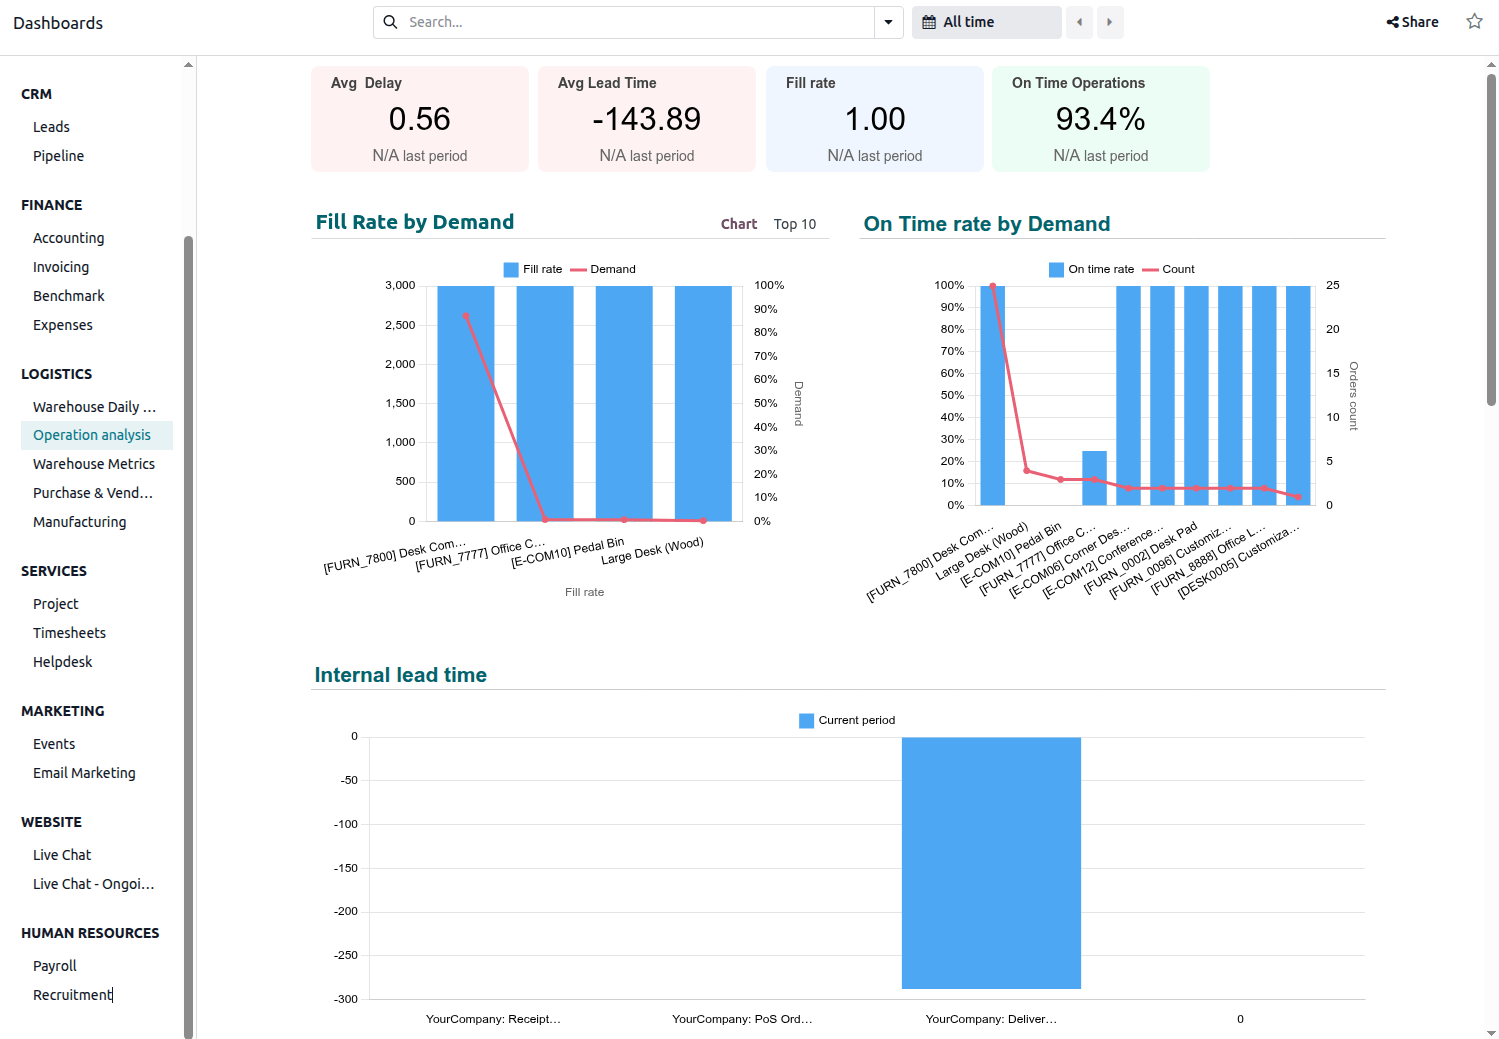
O painel Análise de operações se concentra em KPIs relacionados à eficiência e precisão dos movimentos de estoque. Ajuda a identificar áreas de melhoria de processos ao mostrar métricas como o tempo médio em que as transferências estão vencidas, o tempo médio entre a criação e validação de transferências, e a porcentagem de transferências no prazo. Também fornece insights sobre precisão de entrega ao mostrar a porcentagem de produtos realmente entregues versus ordenados.
Navegue no painel
Quatro cards no topo do painel mostram as seguintes informações:
Avg Delay: indicates the average number of days, in decimal format, that completed
deliveries were overdue (i.e., the date the delivery status changed to Done minus the
scheduled date for the delivery) in the selected period.
Avg Lead Time: indicates the average number of days, in decimal format, between the
creation and the validation of transfers.
Fill rate: indicates the percentage of products delivered in relation to the total
number of products ordered.
On Time Operations: indicates the percentage of transfers made on time for the
selected operation (i.e., the transfer date is less than or equal to scheduled date for the
transfer).
Os seguintes gráficos estão disponíveis:
Fill Rate by Demand: shows the percentage of products delivered in relation to the
total number of products ordered.
On Time rate by Demand: shows the percentage of transfers made on time by product.
Internal lead time: shows the average time between the creation and the validation of
transfers by operation.
Moves lines count by operation: shows the total number of completed stock move lines
by operation type over the selected period.
Weekly Stock Moves Lines by operation: shows the total number of completed stock move
lines weekly, by operation type.
Transfer count by responsible and operation: shows the number of transfers by
employee, detailing the type of operation.
Quantity of stock adjustments by category: shows adjusted stock quantity, by product
category.
Qty scrapped product by category: shows the quantity of product scrapped, by product
category.
Painel de Métricas de Armazém
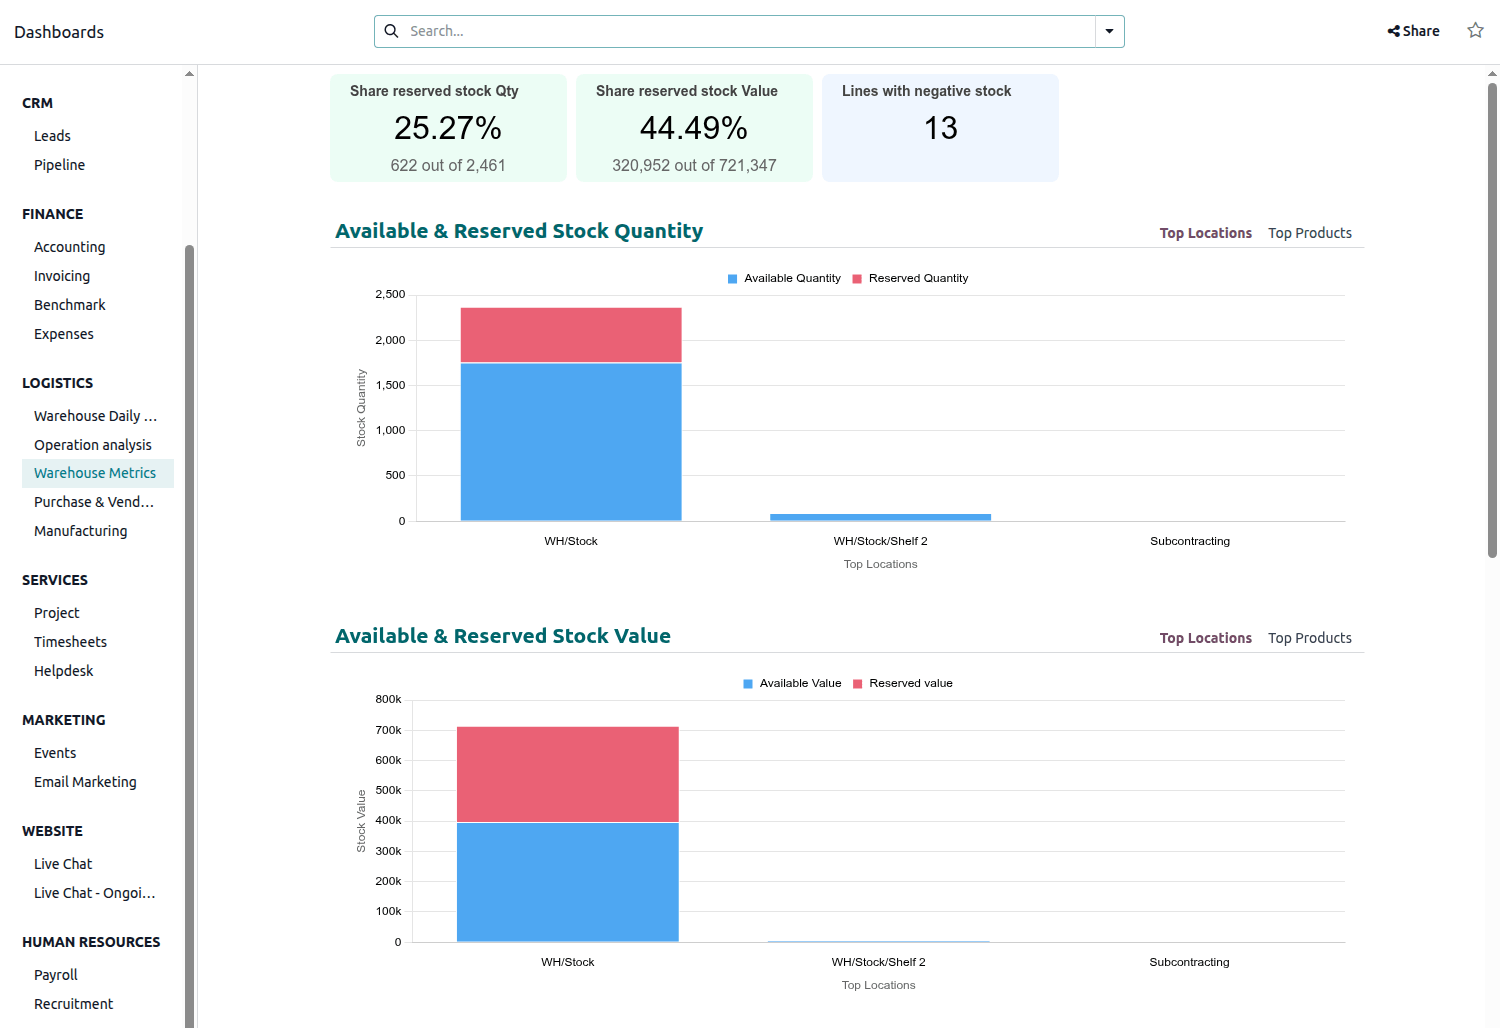
O painel Métricas de Armazém fornece uma visão de alto nível do valor e disponibilidade do estoque. Permite monitorar os níveis de reserva de estoque tanto em quantidade quanto em valor, identificar produtos com estoque negativo e analisar a distribuição e valor do estoque nas localizações mais utilizadas e produtos principais. Também rastreia detalhes importantes como a data de criação do estoque, para que gerentes de armazém ou compras possam identificar produtos de movimento lento ou estagnados e tomar ações, como promoção, desconto ou devolução de produtos.
Navegue no painel
Três cards no topo do painel mostram as seguintes informações:
Share reserved stock Qty: indicates the quantity of stock reserved in relation to the
total quantity of stock on hand, both as a percentage and number.
Share reserved stock value: indicates the value of reserved stock in relation to the
total value of stock on hand, both as a percentage and number.
Lines with negative stock: indicates the number of inventory lines with a negative
stock quantity.
Os seguintes gráficos estão disponíveis:
Available & Reserved Stock Quantity: shows the quantity of available stock (i.e.,
stock on hand minus reserved stock) and the quantity of reserved stock, per most-used location. At
the top right of the chart, click Top Products to see this information for the top
products, i.e., the products with the highest quantities.
Available & Reserved Stock Value: shows the value of available stock (i.e., stock on
hand minus reserved stock) and the value of reserved stock, per most-used location. At the top
right of the chart, click Top Products to see this information for the top products,
i.e., the products with the most total value.
Ageing stock qty by product and creation date: shows, by product, the quantity of
stock that has been held since its creation. To change the creation date period, hover over the
chart then select the desired period from the dropdown.
Ageing stock value by product and creation date: shows, by product, the value of
stock that has been held since its creation. To change the creation date period, hover over the
chart then select the desired period from the dropdown.
Top 10 products with negative stock: shows the ten products with the most negative
stock. Depending on the situation, manual stock corrections may be needed for products shown here.
By default, this is shown as a donut chart; click Top 10 at the top right of
the chart to see this in list form.