Relatórios em PDF
Com o Estúdio, você pode editar relatórios PDF existentes <studio/pdf-reports/edit> (ex.: faturas, cotações, etc.) ou criar novos relatórios <studio/pdf-reports/edit>.
Layout padrão
O layout padrão dos relatórios é gerenciado fora do Estúdio. Vá para e, em seguida, na seção Empresas da página principal, clique em Configurar layout do documento. As configurações de layout são específicas da empresa, mas se aplicam a todos os relatórios.
Usar as seguintes definições:
Layout: Seven layouts are available:
Claro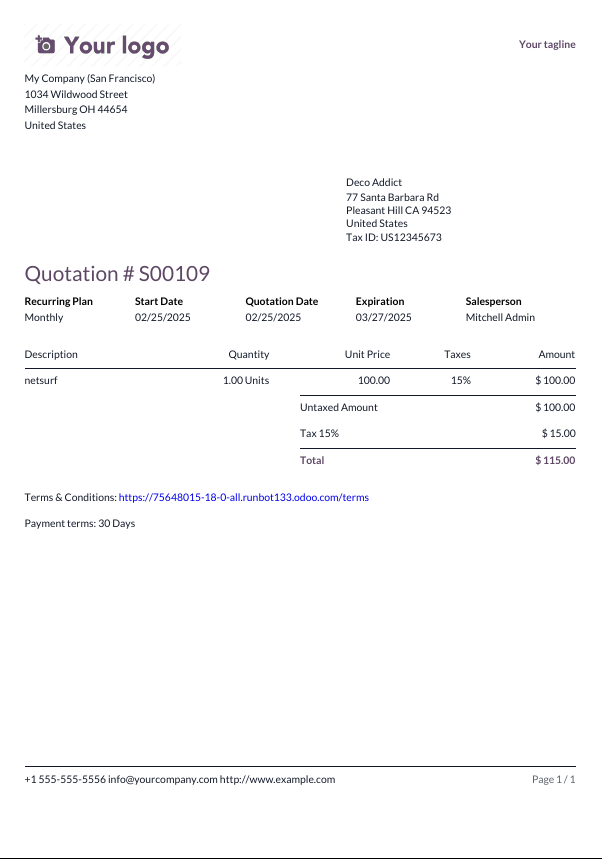 Encaixotado
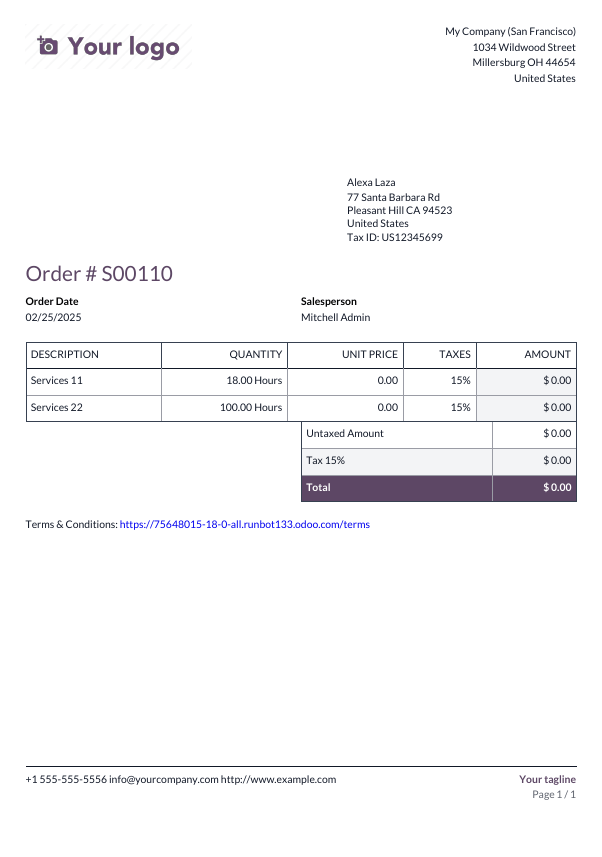 Negrito
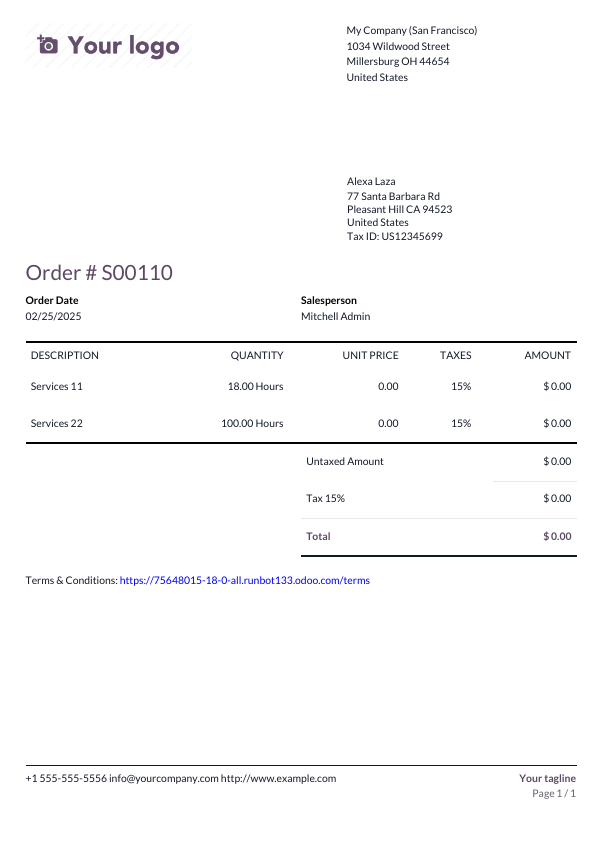 Listrado
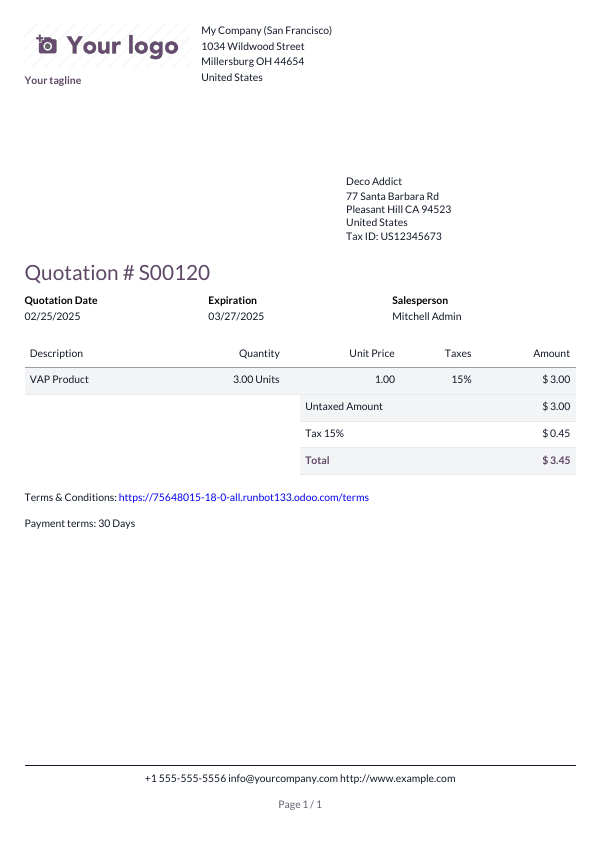 Bolhas
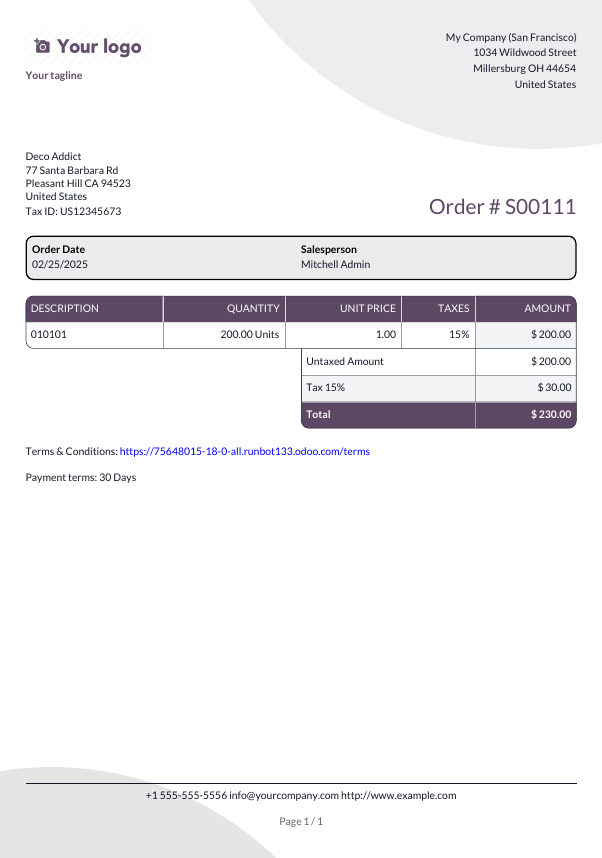 Onda
Onda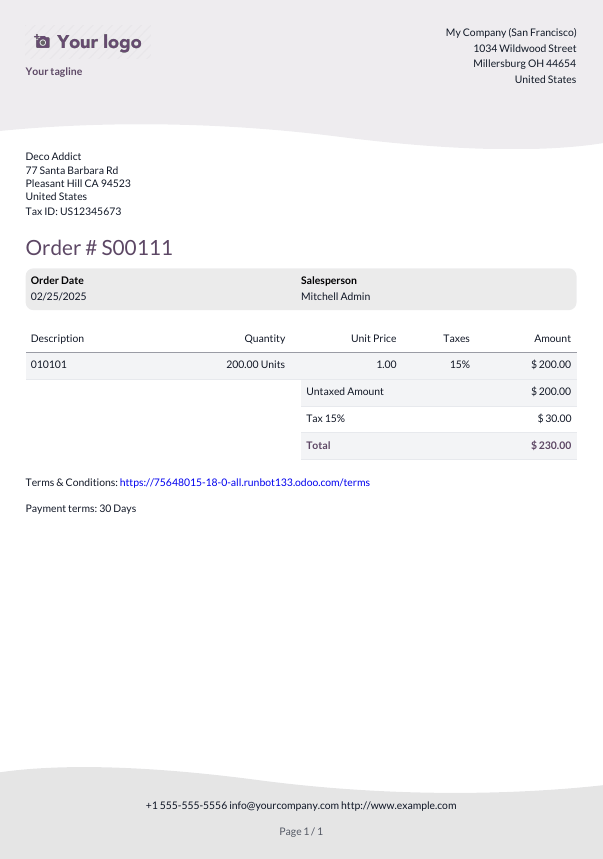 Pasta
Pasta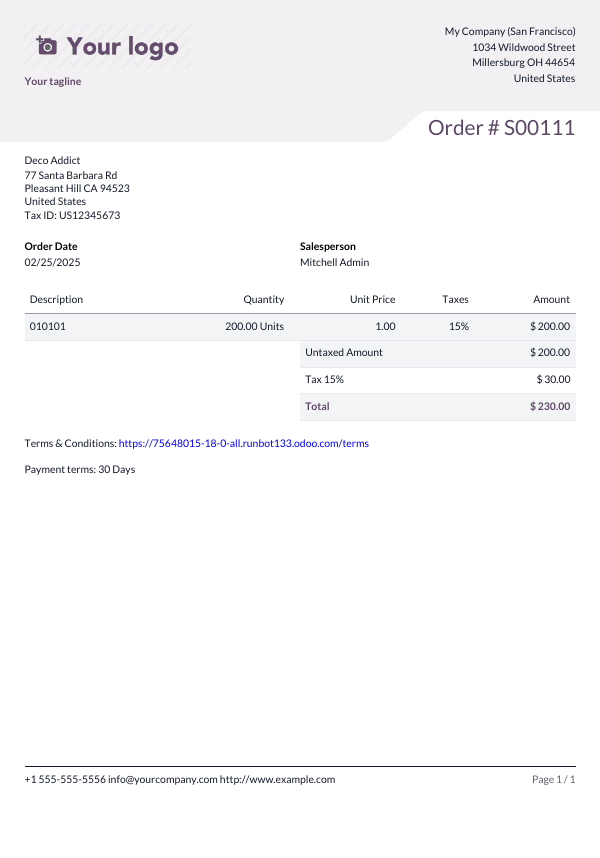
Background: The following backgrounds are available:
Blank: Nothing is displayed.
Demo logo: A demo logo is displayed in the background.
Custom: Upload a custom background image.
Text: Eight fonts are available: Lato, Roboto, Open Sans, Montserrat, Oswald, Raleway, Tajawal (which supports Arabic and Latin scripts), and Fira Mono. Go to the Google Fonts website to preview them.
Company logo: Click the Edit button to upload or change the logo. This adds the logo to the company’s record on the Company model, which you can access by going to and then clicking Update Info in the Companies section.
Colors: Change the primary and secondary colors used to structure reports. The default colors are automatically generated based on the colors of the logo.
Address: The company name and address are displayed in the header of external reports <studio/pdf-reports/header-footer>. You can add multiple lines of text.
Tagline: This is displayed in the header of external reports <studio/pdf-reports/header-footer> using the Light, Striped, Bubble, Wave and Folder layouts and in the footer of external reports using the Boxed and Bold layouts. You can add multiple lines of text.
Paper format: This defines the default paper size of reports. You can select A4 (21 cm x 29.7 cm) and US Letter (21.59 cm x 27.54 cm). This can also be defined for individual reports in the Paper format field in Studio <studio/pdf-reports/edit-options>.
Criação de novos relatórios em PDF
Para criar um novo relatório para um modelo (por exemplo, pedidos de vendas), acesse o modelo, clique no botão oi-studio (Alternar Estúdio) e, em seguida, clique em Relatórios. Clique em Novo e, na janela pop-up que se abre, selecione o tipo de relatório. Isso é usado exclusivamente para determinar o que é exibido no cabeçalho e no rodapé:
Depois de criar o relatório, você pode começar a editá-lo <studio/pdf-reports/edit>.
Edição de relatórios em PDF
Para acessar os relatórios disponíveis para um modelo, acesse o modelo, clique no botão oi-studio (Alternar Estúdio) e, em seguida, clique em Relatórios. Selecione um relatório existente para abri-lo.
Como alternativa, você também pode abrir o Estúdio, clicar em Relatórios e procurar um relatório ou modelo específico.
Opções
Depois de selecionar ou criar um relatório, você pode usar as opções na parte esquerda da tela para:
Change the Report name: The new name is applied everywhere (in Studio, in the Print menu under the fa-cog (gear) icon in the form view, and in the PDF file name).
Modify the Paper format: If no value is selected, the format defined in the default layout <studio/pdf-reports/default-layout-paper> is used.
Show in print menu: to add the report to the Print menu in the form view.
Reload from attachment: to save the report as an attachment on the record the first time it is generated and reload the original version of the report any subsequent time. This is legally required for invoices and is mainly used in this case.
Limit visibility to groups: to limit the availability of the PDF report to specific user groups.
Edit sources: to modify the report directly in the XML file <studio/pdf-reports/XML-editing>.
Reset report: to discard all changes made to the report and reset it to its standard version.
Print preview: to generate and download a report preview.
Editor de relatórios
O editor de relatórios permite modificar o conteúdo e a formatação do relatório.
Blocos condicionais
Os retângulos tracejados representam blocos condicionais (instruções if/else). Eles são usados para mostrar/ocultar conteúdo com base em condições específicas. Clique no bloco para visualizar as condições.
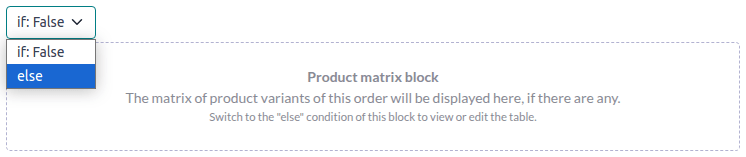
Selecione um valor para visualizar o resultado correspondente e editá-la, se necessário.
Outros conteúdos
Há dois tipos de conteúdo de texto nos relatórios:
Static text, i.e., the text that is not highlighted in blue, which can be modified directly in the editor.
Dynamic text, i.e., the text that is highlighted in blue, which is replaced by field values when the report is generated, e.g., the sales order number or the quotation date.
Você pode adicionar conteúdo (ex.: campos, listas, tabelas, imagens, banners, etc.) ao relatório usando comandos. Digite / para abrir a powerbox <essentials/html_editor/commands> e, em seguida, digite o nome do comando ou selecione-o na lista.
Para adicionar texto estático ao relatório, digite o texto onde você quiser.
Para fazer alterações mais avançadas, você pode editar o relatório no XML diretamente <studio/pdf-reports/XML-editing>.
Adicionar um campo
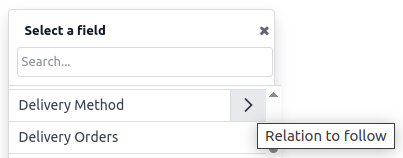
Para adicionar um campo, digite / e selecione o comando Campo. Na lista que se abre, selecione ou pesquise o campo; clique na seta para a direita ao lado do nome do campo para acessar a lista de campos relacionados, se necessário. Em seguida, especifique o valor padrão que será mostrado se o campo não estiver preenchido no registro e pressione Enter.
Adicionar ou editar uma tabela
Há dois tipos de tabelas nos relatórios:
Static tables <studio/pdf-reports/static-table>, which are used to display static text or fields. For this type of table, you define the number of columns and rows when adding the table.
Dynamic tables <studio/pdf-reports/dynamic-table>, which are used to display data from relational fields <studio/fields/relational-fields>. For this type of table, you only define the number of columns when adding the table. The number of rows in the generated report will be determined by the number of records in the related model that are linked with the current model.
Adicionar ou editar uma tabela estática
Para adicionar uma tabela estática, digite / e selecione o comando Tabela. Determine o número de colunas e linhas da tabela. Depois que a tabela tiver sido adicionada, você poderá começar a editá-la.
Você pode inserir, mover e excluir colunas e linhas usando as ferramentas de tabela. Posicione o cursor na parte superior da coluna ou à esquerda da linha, clique no retângulo roxo e selecione uma opção.
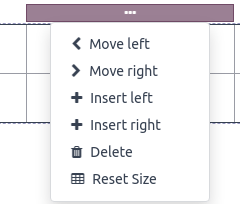
Para redimensionar uma coluna, arraste a borda da coluna até a posição desejada; redefina todas as colunas para o tamanho padrão selecionando Redefinir tamanho nas ferramentas da tabela.
Adicione o campo de sua escolha <studio/pdf-reports/add-field> em uma célula, ou adicione texto estático digitando-o.
Adicionar ou editar uma tabela dinâmica
Para adicionar uma tabela dinâmica, digite / e selecione o comando Tabela dinâmica. Na lista que se abre, selecione ou pesquise a relação na qual a tabela se baseará e pressione Enter. Depois que a tabela tiver sido adicionada, você poderá começar a editá-la.
Você pode inserir, mover e excluir colunas usando as ferramentas de tabela, como em uma tabela estática <studio/pdf-reports/static-table>. Também é possível inserir linhas estáticas que aparecerão acima ou abaixo das linhas geradas.
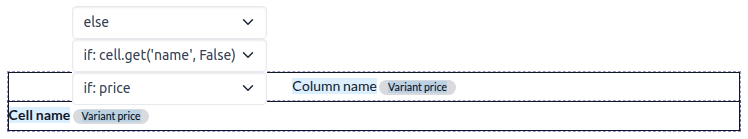
Para adicionar um campo a uma célula, exclua qualquer texto de espaço reservado e adicione o campo de sua escolha <studio/pdf-reports/add-field>. A caixa de diálogo que se abre mostra o objeto de origem do campo (ex.: o modelo Linhas do pedido) e a lista de campos disponíveis.
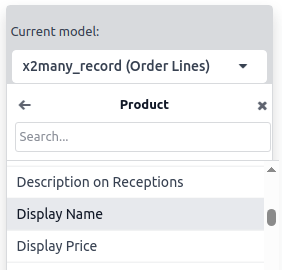
Substitua o rótulo Nome da coluna pelo rótulo de sua escolha.
Formatação
Para formatar o texto no relatório, selecione-o e, em seguida, formate-o usando as opções no editor de texto.
Editar o XML do relatório
Para editar o XML do relatório, clique em Editar fontes no painel esquerdo.
Exemplos
Para alterar a forma como os dados são apresentados em seu relatório, você pode modificar manualmente o widget padrão de um campo. No exemplo abaixo, a data do pedido mostra a data e a hora por padrão, enquanto o preço unitário tem como padrão uma precisão de duas casas decimais.
<div class="oe_structure">
 <span t-field="doc.date_order"/>
 <span t-field="doc.price_unit"/>
</div>
É possível modificar esses campos usando t-options, nesse caso a opção widget, para mostrar apenas a data e uma precisão de quatro casas decimais, respectivamente:
<div class="oe_structure">
 <span t-field="doc.date_order" t-options="{'widget': 'date'}"/>
 <span t-field="doc.price_unit" t-options="{'widget': 'float', 'precision': 4}"/>
</div>
Se quiser mostrar/ocultar conteúdo com base em condições específicas, você pode adicionar manualmente instruções de controle if/else no XML do relatório.
Por exemplo, se você quiser ocultar uma tabela de dados personalizada se não houver marcadores, poderá usar o atributo t-if para definir a condição, que é então avaliada como Verdadeira ou Falsa. A tabela não será exibida se não houver cotações na cotação.
<!-- table root element -->
<table class="table" t-if="len(doc.tag_ids) > 0">
    <!-- thead = table header, the row with column titles -->
    <thead>
        <!-- table row element -->
        <tr>
            <!-- table header element -->
            <th>ID</th>
            <th>Name</th>
        </tr>
    </thead>
    <!-- table body, the main content -->
    <tbody>
        <!-- we create a row for each subrecord with t-foreach -->
        <tr t-foreach="doc.tag_ids" t-as="tag">
            <!-- for each line, we output the name and price as table cells -->
            <td t-out="tag.id"/>
            <td t-out="tag.name"/>
        </tr>
    </tbody>
</table>
Se quiser exibir outro bloco caso a instrução t-if seja avaliada como Falsa, você poderá especificá-lo usando a instrução t-else. O bloco t-else deve seguir diretamente o bloco t-if na estrutura do documento. Não há necessidade de especificar nenhuma condição no atributo t-else. Como exemplo, vamos mostrar uma mensagem rápida explicando que não há marcadores na cotação:
<!-- table root element -->
<table class="table" t-if="len(doc.tag_ids) > 0">
    <!-- thead = table header, the row with column titles -->
    <thead>
        <!-- table row element -->
        <tr>
            <!-- table header element -->
            <th>ID</th>
            <th>Name</th>
        </tr>
    </thead>
    <!-- table body, the main content -->
    <tbody>
        <!-- we create a row for each subrecord with t-foreach -->
        <tr t-foreach="doc.tag_ids" t-as="tag">
            <!-- for each line, we output the name and price as table cells -->
            <td t-out="tag.id"/>
            <td t-out="tag.name"/>
        </tr>
    </tbody>
</table>
<div class="text-muted" t-else="">No tag present on this document.</div>
Ao usar a notação t-if/t-else, o editor de relatórios reconhece que essas seções são mutuamente exclusivas e devem ser exibidas como blocos condicionais:
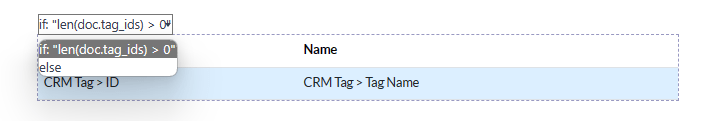
Você pode alternar as condições usando o editor para visualizar o resultado:

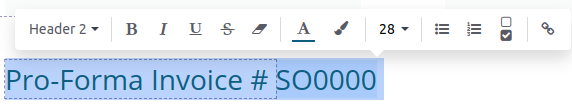
Se quiser ter várias opções, você também pode usar as diretivas t-elif para adicionar condições intermediárias. Por exemplo, é assim que o título dos relatórios de pedidos de vendas muda com base na condição do documento subjacente.
<h2 class="mt-4">
    <span t-if="env.context.get('proforma', False) or is_pro_forma">Pro-Forma Invoice # </span>
    <span t-elif="doc.state in ['draft','sent']">Quotation # </span>
    <span t-else="">Order # </span>
    <span t-field="doc.name">SO0000</span>
</h2>
O título Fatura Pro-Forma é usado dependendo de algumas condições contextuais. Se essas condições não forem atendidas e a situação do documento for provisório ou enviado, será usada Cotação. Se nenhuma dessas condições for atendida, o título do relatório será Pedido.
Trabalhar com imagens em um relatório pode ser um desafio, pois o controle preciso sobre o tamanho e o comportamento da imagem nem sempre é óbvio. É possível inserir campos de imagem pelo editor de relatórios (usando o comando Field <studio/pdf-reports/add-field>), mas inseri-los em XML usando a diretiva t-field e os atributos t-options que a acompanham oferece melhor controle de dimensionamento e posicionamento.
Por exemplo, o código a seguir gera o campo image_128 do produto da linha como uma imagem de 64px de largura (com uma altura automática baseada na proporção da imagem).
<span t-field="line.product_id.image_128" t-options-widget="image" t-options-width="64px"/>
As seguintes opções estão disponíveis para widgets de imagem:
width: width of the image, usually in pixels or CSS length units (e.g., rem) (leave empty for auto-width).
height: height of the image, usually in pixels or CSS length units (e.g., rem) (leave empty for auto-height).
class: CSS classes applied on the img tag; Bootstrap classes are available.
alt: alternative text of the image
style: style attribute; it allows you to override styles more freely than with Bootstrap classes.
Esses atributos devem conter cadeias de caracteres, ou seja, texto entre aspas dentro de aspas, por exemplo, t-options-width="'64px'" (ou, alternativamente, uma expressão Python válida).
O widget de imagem não pode ser usado em um marcador img. Em vez disso, defina a diretiva t-field em um nó span (para conteúdo em linha) ou div (para conteúdo em bloco).
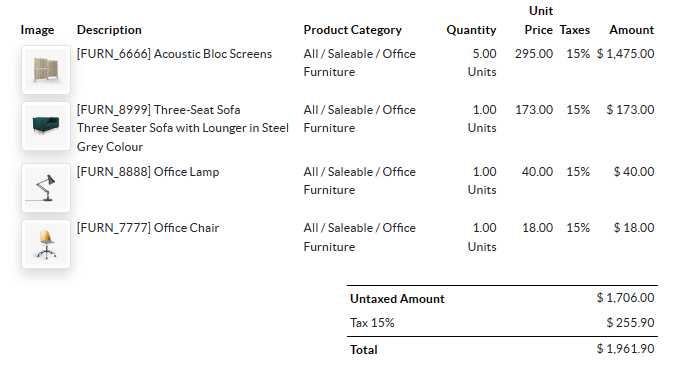
Por exemplo, vamos adicionar uma coluna com a imagem do produto na tabela de cotação:
<table class="table table-sm o_main_table table-borderless mt-4">
    <thead style="display: table-row-group">
        <tr>
            <th>Image</th>
            <th name="th_description" class="text-start">Description</th>
            <th>Product Category</th>
            <th name="th_quantity" class="text-end">Quantity</th>
            <th name="th_priceunit" class="text-end">Unit Price</th>
[...]
        <t t-foreach="lines_to_report" t-as="line">
            <t t-set="current_subtotal" t-value="current_subtotal + line.price_subtotal"/>
            <tr t-att-class="'bg-200 fw-bold o_line_section' if line.display_type == 'line_section' else 'fst-italic o_line_note' if line.display_type == 'line_note' else ''">
                <t t-if="not line.display_type">
                   <td>
                       <span t-field="line.product_template_id.image_128"
                             t-options-widget="'image'"
                             t-options-width="'64px'"
                             t-options-class="'rounded-3 shadow img-thumbnail'"
                           />
                   </td>
                    <td name="td_name"><span t-field="line.name">Bacon Burger</span></td>
                    <td t-out="line.product_id.categ_id.display_name"/>
O atributo t-options-width restringe a largura da imagem a 64 pixels, e as classes o Bootstrap usadas em t-options-class criam uma borda semelhante a uma miniatura com cantos arredondados e uma sombra.