O painel Análise de Compras e Fornecedores, disponível no aplicativo Painéis Odoo, oferece várias métricas para avaliar o desempenho de compras e a confiabilidade do fornecedor.
O painel rastreia dados financeiros como valor total e médio de compras e o número de pedidos de compra. Também fornece KPIs de desempenho de fornecedores, como o tempo médio para receber produtos e o percentual de quantidades recebidas no prazo. Isso permite classificar fornecedores e otimizar a estratégia de suprimentos de acordo.
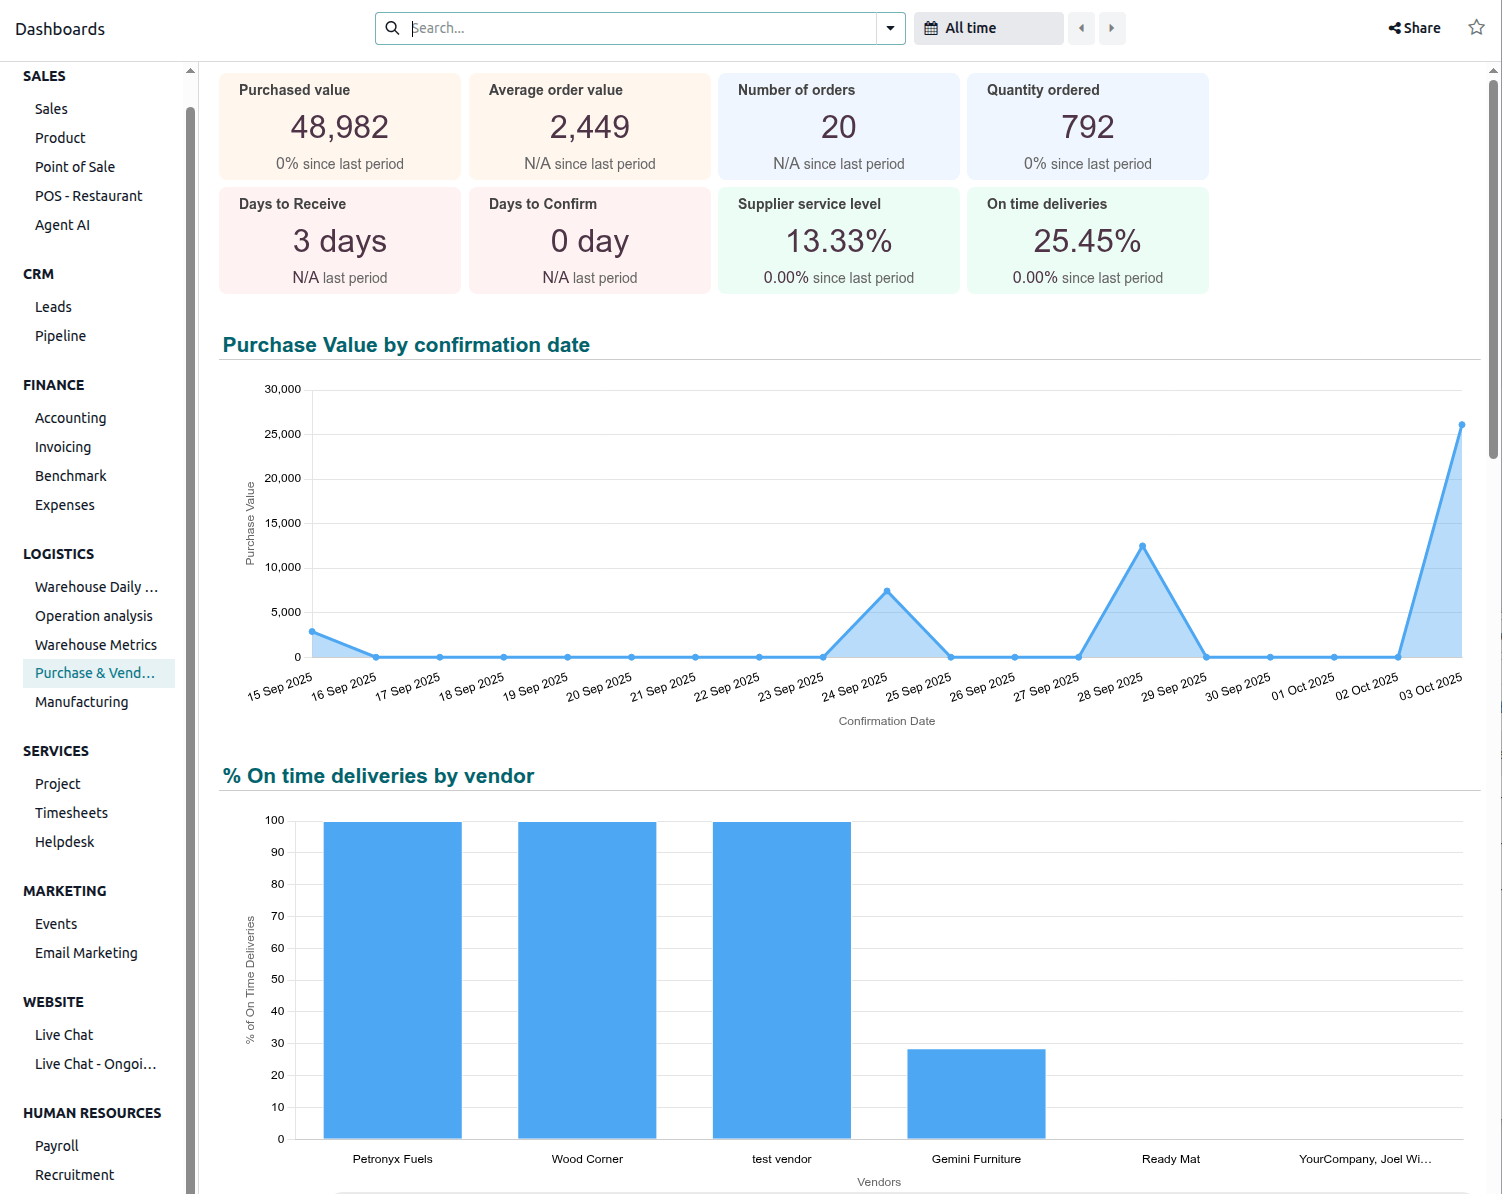
Para acessar o painel Análise de Compras e Fornecedores, vá para o aplicativo Painéis, depois, no painel esquerdo, navegue até a seção Logística e clique no nome do painel. O painel se abre na visualização principal.
Oito cartões na parte superior do painel exibem as seguintes informações:
Purchased value: indicates the total value of purchases during the selected period.
Average order value: indicates the average purchase amount per order during the
selected period.
Number of orders: indicates the number of purchase orders during the selected period.
Quantity ordered: indicates the quantity of products ordered during the selected
period.
Days to receive: indicates the average number of days between the order and receipt of
purchased products (i.e., between the order deadline of the purchase order and the expected
arrival of the purchase order line).
Days to Confirm: indicates the average number of days before a purchase order is
confirmed (i.e., between the creation date of the RFQ and the confirmation date of the purchase
order).
Supplier service level: indicates the quantity received versus the quantity purchased,
as a percentage.
On time deliveries: indicates the percentage of products received on time (based on
the expected arrival date on purchase order lines)
Os seguintes gráficos estão disponíveis:
Purchase Value by confirmation date: shows the total value of confirmed purchases by
date.
% On time deliveries by vendor: shows the percentage of products received on time, by
vendor (based on expected arrival on purchase order lines.)
Top vendors by amount: shows the ranking of vendors by total value of purchase orders
and number of purchase orders.
Top vendors by lead time in days: shows the average number of days required to receive
purchased products, by vendor (Order deadline purchase order - Expected
arrival purchase order line).
Average product purchased cost by confirmation week: shows the average unit cost of
products purchased, by week in which the purchase order is confirmed.
Top purchase orders by value: lists the ten purchase orders with the highest total
value, in descending order.
Top 10 late receipts: lists the ten receipts with the longest delay after the expected
receipt date.
Top purchased products: lists the ten products with the highest total purchase amount,
in descending order.
Purchase Orders by Buyer: shows the percentage of purchases by buyer.